
The Inventory Order Status Report helps you keep track of items sold during a specific period of time, if any items are currently on order, and when they are due to arrive.
Accessing the Report
There are two ways you can access this report.
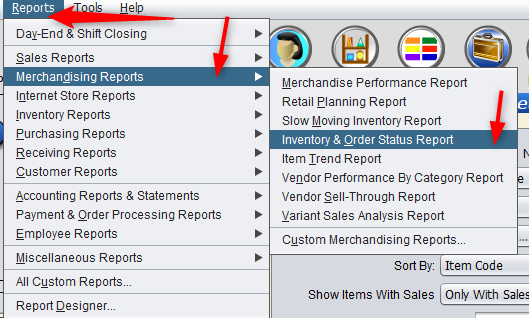
Click on “Reports,” “Merchandising Reports,” and “Inventory Order Status Report” from the toolbar.
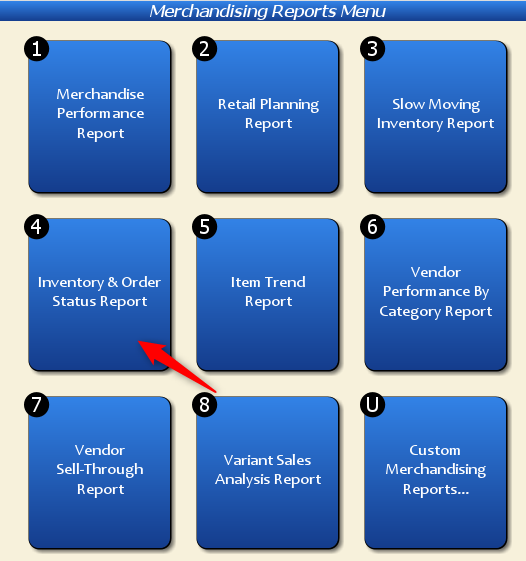
Or, click on the “Reports” button on the “Main Menu.”

Next, click on “Merchandising Reports.”

Then, select “Inventory and Order Status Report.”
Either way, you’ll end up at the following screen. This screen will default to preset fields, and the date range will automatically default to the month you’re currently in.

However, you may adjust the fields as necessary. You can also save these adjustments and set them to automatically appear the next time you open the report by selecting “Save as Defaults for this Report (except dates).”

This report might be multiple pages depending on the size of your inventory. Keep this in mind if you are going to print the report.
Setting Up Your Report
Show Subtotals Only: Selecting “Yes” will only include units sold in your current date range, units sold in your reference date range, and your current QOH.
Group By: This controls how Artisan will sort your report. For example, if you choose Category Tree, Artisan will sort each section alphabetically by category.
2nd Group By: If you want to further filter how Artisan organizes this report, select either by Category Tree or Vendor Code.
Sales Site: Determine if you want to see inventory, sales, and order status information for all sites or a specific site.
Show Items With Sales: Determine if the report will include items that have a sales history, only items that haven’t been sold, or both.
Selected Sales Date Range: Enter a date range manually or use the dropdown calendar. This is the range Artisan will pull data from.
Reference Date Range: If you want to compare your Selected Date Range to a different date range, enter it here manually or use the dropdown calendar.
You may further filter this report to include only specific items, descriptions, vendors, vendor purchase numbers, item keywords, and categories. Simply type in the item code, description, vendor code, etc or use the magnifying glass to locate them.
There are other fields to the right of this section to include and exclude other items by discontinued, variants, consignment, non-inventory, out-of-stock, and other options.
Price Range: Leave as-is to use the default amounts or enter a specific price range.
Unit Cost Range: Leave as-is to use the default amounts or enter a specific Unit Cost Range.
Report Example

Click on the image to expand.
We can see in this example that our report is compared against two date ranges, and separated by category with items listed alphabetically by Item Code.
The “Unit Cost” represents how much it cost to buy the item. The Retail Price is the amount we listed the item for. For example, the Friendship Bracelet cost $1 for us to purchase, and we sold it for $5.00.
“Units Sold” represents the amount sold within the specified Date Range, while the next column displays the quantity sold in the reference date range. For example, we sold two Friendship Bracelets in the specified date range and one in the reference date range.
The “QOH” represents the amount we currently have in-stock. We have received four Friendship Bracelets.
The next section is the “On Order” section. This represents any items we currently have on-order, the quantity on order, the purchase order number, and when these items are due to arrive. We do not have any Friendship Bracelets on order, but if we look down this column, we’ll see we have some Knit Scarves, Women’s Watches, and posters on order.