This article is currently under construction
To keep track of items that aren’t being sold, we suggest using the “Slow Moving Inventory Report.” This report looks for items that have more inventory than sales and breaks this information down by date and amount sold.
A common solution to slow-moving inventory is to put the items on sale or simply move them to a different part of the store that’s more noticeable to customers. Either way, this report can help you make an informed decision about how you want to resolve these non-selling products.
Note: Make sure you have posted your Day End for the selected date range in the report. Otherwise, sales made within that date range will not show. Click here to learn how to post a Day End.
Accessing the Report
There are two ways you can access this report.
Click on “Reports,” “Merchandising Reports,” and “Slow Moving Inventory Report” from the toolbar.

Or, click on the “Reports” button on the “Main Menu.”

Next, click on “Merchandising Reports.”

Then, select “Slow Moving Inventory Report.”

Either way, you’ll end up at the following screen. This screen will default to preset fields, and the date range will automatically default to the month you’re currently in.

However, you may adjust the fields as necessary. You can also save these adjustments and set them to automatically appear the next time you open the report by selecting “Save as Defaults for this Report (except dates).“

This report might be multiple pages depending on the size of your inventory. Keep this in mind if you are going to print the report.
Setting Up Your Report
The following section goes over the individual settings you can customize for your report.
Group By
Category or Vendor
Decide if you want your items broken down by category or vendor first. In the next step, you can choose a secondary category to fine-tune the organization.

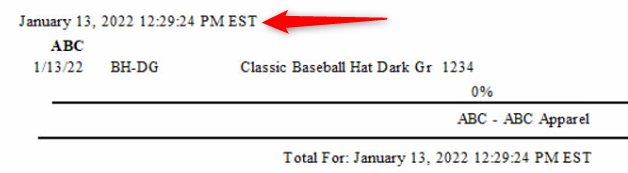
Group By Receive Date/Time: This includes the date the items were received into Artisan as well as a timestamp (ex. January 13, 2022, 12:29:24 PM EST).
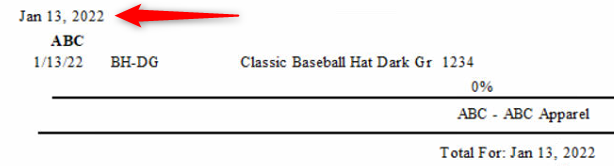
Group By Receive Date: This only displays the date received into Artisan (ex. January 13, 2022).
Secondary Group
Choose your secondary group: vendor or category. Or, you may select “No Grouping.”

- For example, this is the report with “Group By” and “Secondary Group” to “Category.”

Notice how the categories are sorted alphabetically, and the items within those categories are sorted alphabetically as well.
- Main and secondary group set to “Vendor.”

Notice how the vendors are sorted alphabetically, and the items within those vendor groups are sorted alphabetically as well.
By Category, No Grouping:
 With no secondary group selected, you’ll only see the category name and items listed.
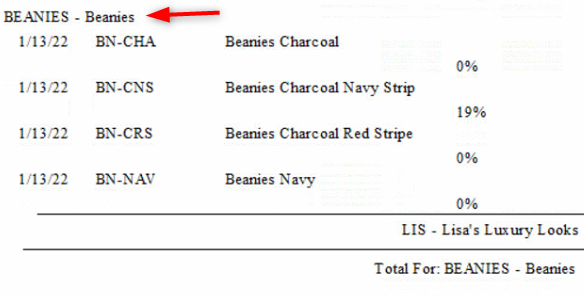
By Vendor, No Grouping:

With no secondary group selected, you’ll only see the vendor name and items listed.
Sort By
This is how the items within the groups will be sorted. For example, if you choose “By Item Code,” the items will be ranked alphabetically by their item code.

You can also sort by vendor P/N number.
 Or alphabetically by description.

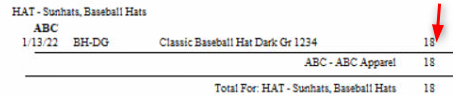
Show Stock Unit Detail?
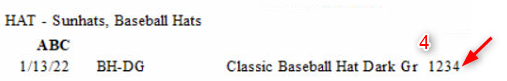
If selected, this shows the number of items you currently have on hand. For example, we have 18 of the Classic Dark Baseball Hats in stock:
Show Detail Row?
Instructions coming soon
Custom Sale Date Range
Input the sales information you want to see for a specific date range. For example, from April 1 to April 30, 2022.
Sales Threshold (Units)
The amount of money that specific items generated. For example, if you want to exclude items that generated more than $100 in sales, input 100 into this field.
Sales Over QOH %
This number is the percentage of items sold versus what you have in stock. For example, only one item is sold within the date range but there are 10 in stock. You set the Sales Over QOH percentage to a higher number (say, 50%). That item will appear on the list. In other words, items with percentages below the number you put here will display.
![]()
Inventory Site
If you have multiple sites, you can choose to view information from all of your sites or narrow it down to one site in particular.

Inventory Is Received Before
Any items received after this date will not be counted in the report. For example, any items accepted in Artisan after March 27th will not appear on the report, but items received before that end date (and within the Custom Sale Date Range) will appear.
![]()
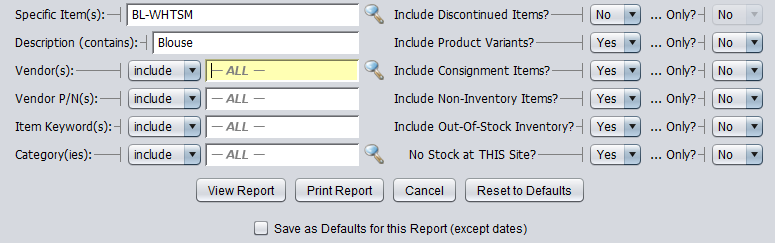
You can narrow down your report further by including specific items, descriptions, vendors, and so forth. In this example, we only want to show the item “BL-WHTSM.”

Reading the Report
Let’s go over how to read the report so you can identify your lowest-selling items. Your report might look different depending on the fields you selected.

1. Received: This column shows when the items were accepted into Artisan.
2. Item Code: This column displays the item codes of the products.
3. Description: This is the items’ description.
4. Vendor P/N: If the item has a vendor part number, it will show here.
5. Sales Over QOH: This percentage is calculated by the amount sold within the custom date range divided by the quantity you currently have in stock. In other words, what percentage of the inventory did you sell?

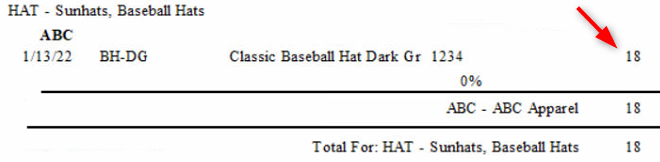
6. Units: This is your quantity on hand. For example, there are 18 Dark Gray Classic Baseball Hats in stock.
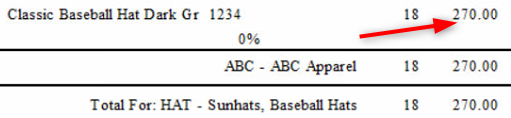
7. Cost: This is the amount you’ve spent purchasing these items. For example, we bought 18 Dark Gray Classic Baseball Hats for $15 each, which totals to $270.
8. Retail: This is the amount the quantity of hand is worth according to the retail price. For example, if we sell each Dark Gray Classic Baseball Hat for $25 each, the total of what we have in stock is $450.

9. Units / Retail Sold from…: This section is the number of items sold within the date range you selected.

10. Units / Retail Sold by Age: This section is separated into date ranges/how long it took an item to sell (0 to 30, 31 to 60, 61 to 90, 91 to 120, 121 to 180, and 181 to 365 days).
The numbers underneath the date ranges indicate how many units of the item were sold and for how much.
